Leveraging Altair to Visualize BloodHound Results
Author: Roberto Rodriguez (@Cyb3rWard0g)
Project: Infosec Jupyter Book
Public Organization: Open Threat Research
License: Creative Commons Attribution-ShareAlike 4.0 International
Reference: https://posts.specterops.io/visualizing-bloodhound-data-with-powerbi-part-1-ba8ea4908422
Import Libraries
from py2neo import Graph
import plotly.graph_objects as go
import altair as alt
alt.renderers.enable('notebook')
RendererRegistry.enable('notebook')
Initialize BloodHound neo4j Database Connection
g = Graph("bolt://206.189.85.93:7687", auth=("neo4j", "BloodHound"))
g
<Graph database=<Database uri='bolt://206.189.85.93:7687' secure=False user_agent='py2neo/4.3.0 neobolt/1.7.15 Python/3.7.3-final-0 (linux)'> name='data'>
Retrieve Security Groups with Local Admin Rights over Computers
Now we’ll construct the Cypher query that tells us the name of each security group in Active Directory and the number of computers that group has local admin rights on.
sg_computers_df = g.run("""
MATCH (g:Group)
OPTIONAL MATCH (g)-[:AdminTo]->(c1:Computer)
OPTIONAL MATCH (g)-[:MemberOf*1..]->(:Group)-[:AdminTo]->(c2:Computer)
WITH g, COLLECT(c1) + COLLECT(c2) AS tempVar
UNWIND tempVar AS computers
RETURN g.name AS GroupName,COUNT(DISTINCT(computers)) AS AdminRightCount
ORDER BY AdminRightCount DESC
""").to_data_frame()
sg_computers_df
| GroupName | AdminRightCount | |
|---|---|---|
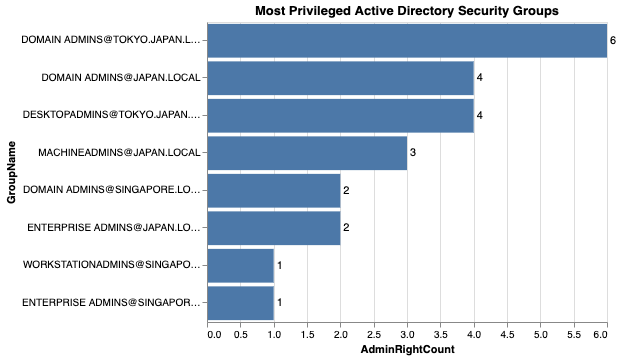
| 0 | DOMAIN ADMINS@TOKYO.JAPAN.LOCAL | 6 |
| 1 | DESKTOPADMINS@TOKYO.JAPAN.LOCAL | 4 |
| 2 | DOMAIN ADMINS@JAPAN.LOCAL | 4 |
| 3 | MACHINEADMINS@JAPAN.LOCAL | 3 |
| 4 | ENTERPRISE ADMINS@JAPAN.LOCAL | 2 |
| 5 | DOMAIN ADMINS@SINGAPORE.LOCAL | 2 |
| 6 | ENTERPRISE ADMINS@SINGAPORE.LOCAL | 1 |
| 7 | WORKSTATIONADMINS@SINGAPORE.LOCAL | 1 |
Create Horizontal Bar Chart: Most Privileged Active Directory Security Groups
bars = alt.Chart(sg_computers_df, title="Most Privileged Active Directory Security Groups").mark_bar().encode(
    x='AdminRightCount:Q',
    y=alt.Y(
        "GroupName:N",
        sort=alt.EncodingSortField(
            field="AdminRightCount",
            order="descending"
        )
    )
)

text = bars.mark_text(
    align='left',
    baseline='middle',
    dx=3
).encode(
    text='AdminRightCount:Q'
)

(bars + text).properties(height=300)
Create Horizontal Bar Chart: Most Privileged Active Directory Security Groups
users_to_da = g.run("""
MATCH (totalUsers:User {domain:'TOKYO.JAPAN.LOCAL'})
MATCH p=shortestPath((UsersWithPath:User {domain:'TOKYO.JAPAN.LOCAL'})-[r*1..]->(g:Group {name:'DOMAIN ADMINS@TOKYO.JAPAN.LOCAL'}))
WITH COUNT(DISTINCT(totalUsers)) as totalUsers, COUNT(DISTINCT(UsersWithPath)) as UsersWithPath
RETURN 100.0 * UsersWithPath / totalUsers AS percentUsersToDA
""").to_data_frame()
users_to_da
| percentUsersToDA | |
|---|---|
| 0 | 13.580247 |
value_df = users_to_da['percentUsersToDA'].values[0]
value_df
13.580246913580247
fig = go.Figure(go.Indicator(
    domain = {'x': [0, 1], 'y': [0, 1]},
    value = (value_df),
    mode = "gauge+number",
    title = {'text': "Percentage of Users with a Path to Domain Admin"},
    gauge = {'axis': {'range': [None, 100]},
             'steps' : [{'range': [0, 250], 'color': "lightgray"}],
             'threshold' : {'line': {'color': "red", 'width': 4}, 'thickness': 0.75, 'value': 490}}))

fig.show()